Statistics
3 Fudge Dice
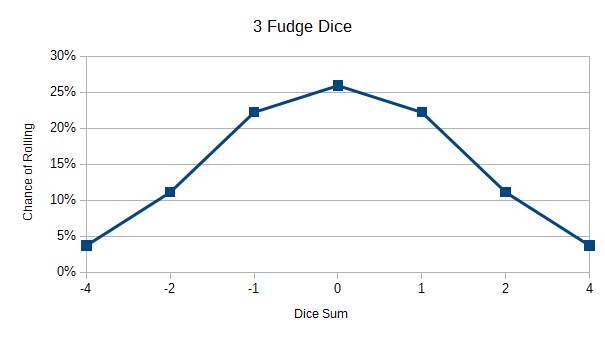
| Sum | Frequency | Chance | At Least |
|---|---|---|---|
| -4 | 1 | 3.704% | 100.000% |
| -2 | 3 | 11.111% | 96.296% |
| -1 | 6 | 22.222% | 85.185% |
| 0 | 7 | 25.926% | 62.963% |
| 1 | 6 | 22.222% | 37.037% |
| 2 | 3 | 11.111% | 14.815% |
| 4 | 1 | 3.704% | 3.704% |
The average sum is 0 and the standard deviation is 1.414.
As the above data shows, the chance of getting a critical success or failure is about 4% each (1/27). The chance of getting a 0 is about 26% (7/27) but the chance of getting at least 0 is about 63% (17/27) therefore it is usually better to roll then it is to take a routine check.
Vs DC
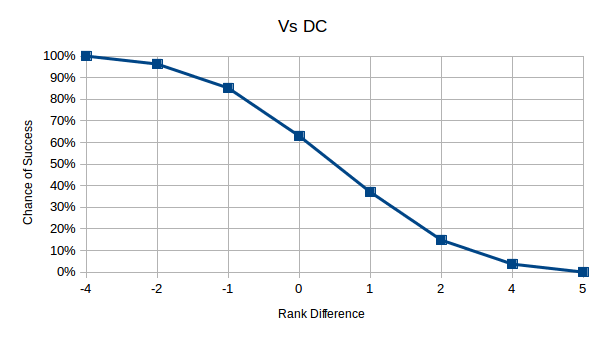
| Difference | Frequency | Chance | At Least |
|---|---|---|---|
| -4 | 1 | 3.704% | 100.000% |
| -2 | 3 | 11.111% | 96.296% |
| -1 | 6 | 22.222% | 85.185% |
| 0 | 7 | 25.926% | 62.963% |
| 1 | 6 | 22.222% | 37.037% |
| 2 | 3 | 11.111% | 14.815% |
| 4 | 1 | 3.704% | 3.704% |
| 5 | 0 | 0% | 0% |
When rolling 3dF vs DC the statistics are the same as 3dF alone. The above graph is a different perspective and has a more tangible application since it shows the difference between rank and DC.
Contested Roll

| Difference | Frequency | Chance | At Least |
|---|---|---|---|
| -8 | 1 | 0.137% | 100.000% |
| -6 | 6 | 0.823% | 99.863% |
| -5 | 12 | 1.646% | 99.040% |
| -4 | 23 | 3.155% | 97.394% |
| -3 | 48 | 6.584% | 94.239% |
| -2 | 84 | 11.523% | 87.654% |
| -1 | 120 | 16.461% | 76.132% |
| 0 | 141 | 19.342% | 59.671% |
| 1 | 120 | 16.461% | 40.329% |
| 2 | 84 | 11.523% | 23.868% |
| 3 | 48 | 6.584% | 12.346% |
| 4 | 23 | 3.155% | 5.761% |
| 5 | 12 | 1.646% | 2.606% |
| 6 | 6 | 0.823% | 0.960% |
| 8 | 1 | 0.137% | 0.137% |
The average difference is 0 and the standard deviation is 2.244.
Damage Roll

| Toughness Difference | Frequency | Average Damage | Chance |
|---|---|---|---|
| -8 | 1 | 8.000 | 100.000% |
| -7 | 6 | 7.001 | 99.863% |
| -6 | 6 | 6.003 | 99.863% |
| -5 | 12 | 5.012 | 99.040% |
| -4 | 23 | 4.038 | 97.394% |
| -3 | 48 | 3.096 | 94.239% |
| -2 | 84 | 2.219 | 87.654% |
| -1 | 120 | 1.458 | 76.132% |
| 0 | 141 | 0.861 | 59.671% |
| 1 | 120 | 0.458 | 40.329% |
| 2 | 84 | 0.219 | 23.868% |
| 3 | 48 | 0.096 | 12.346% |
| 4 | 23 | 0.038 | 5.761% |
| 5 | 12 | 0.012 | 2.606% |
| 6 | 6 | 0.003 | 0.960% |
| 7 | 6 | 0.001 | 0.960% |
| 8 | 1 | 0.000 | 0.137% |
| 9 | 0 | 0.000 | 0.000% |
A specific and useful application of contested rolls is a Damage power check. The chance of success is defined by doing at least 0 damage, that is to say the chance of inflicting a bruised penalty. The statistics can be applied for any rank of Damage or Toughness. For example Damage 9 vs Toughness 5 is a toughness difference of -4 which has a 97.394% that the attacker will succeed.
The Average Damage column is for the average amount of HP dealt per hit assuming it is never a critical hit (since that's determined by the attack skill check not Damage power check).
Note that these numbers can be applied to any contested roll involving traits however the chances assume that there is no automatic success or failure and that you will succeed in the case of a tie. If you lose from a tie then treat your opponent's trait as 1 higher. For example if you are rolling an Affliction 5 power check against a Fortitude of 9 then your chance of success is 2.606%.